
CMS-Pro
Discover the measurement, protection and analysis capabilities of CMS-Pro.
Explore product details ↗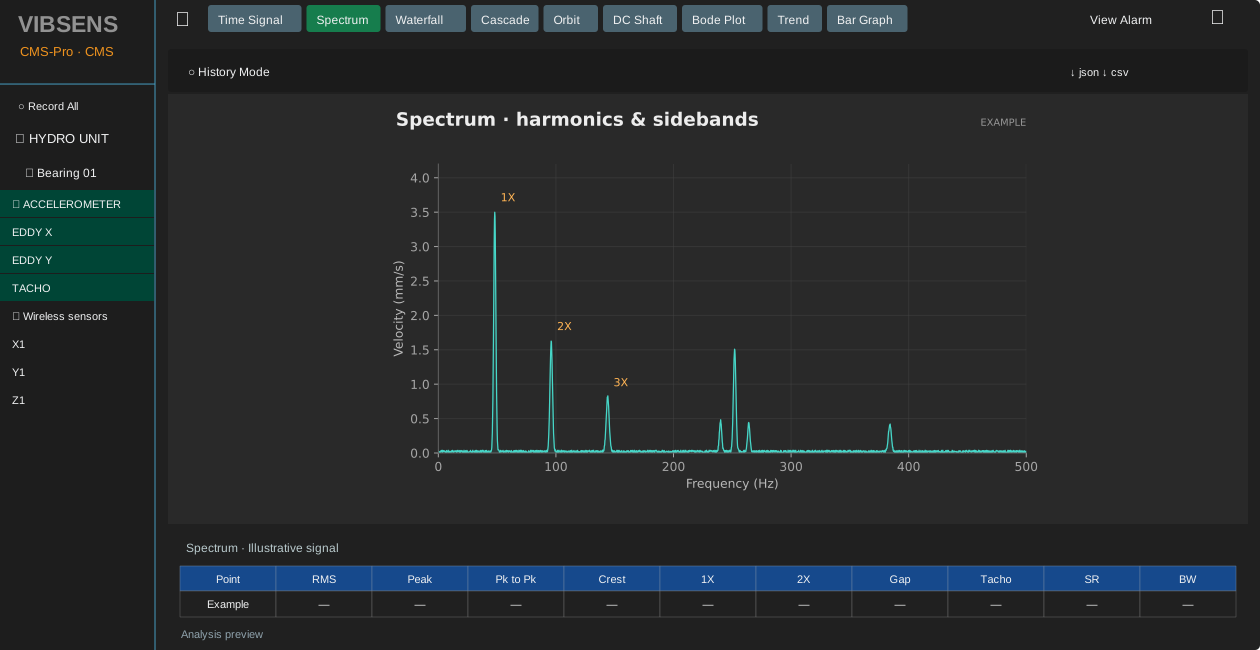
A clearer view of rotating machinery
CMS-Pro supports the engineering process of reviewing vibration data, comparing machine behaviour and investigating changes. The following analysis views explain what each presentation shows and how it contributes to a condition monitoring workflow.
For a complete solution, discuss your machinery, measurement channels and acquisition requirements with VIBSENS. Available views depend on the selected system configuration and the signals supplied to the software.
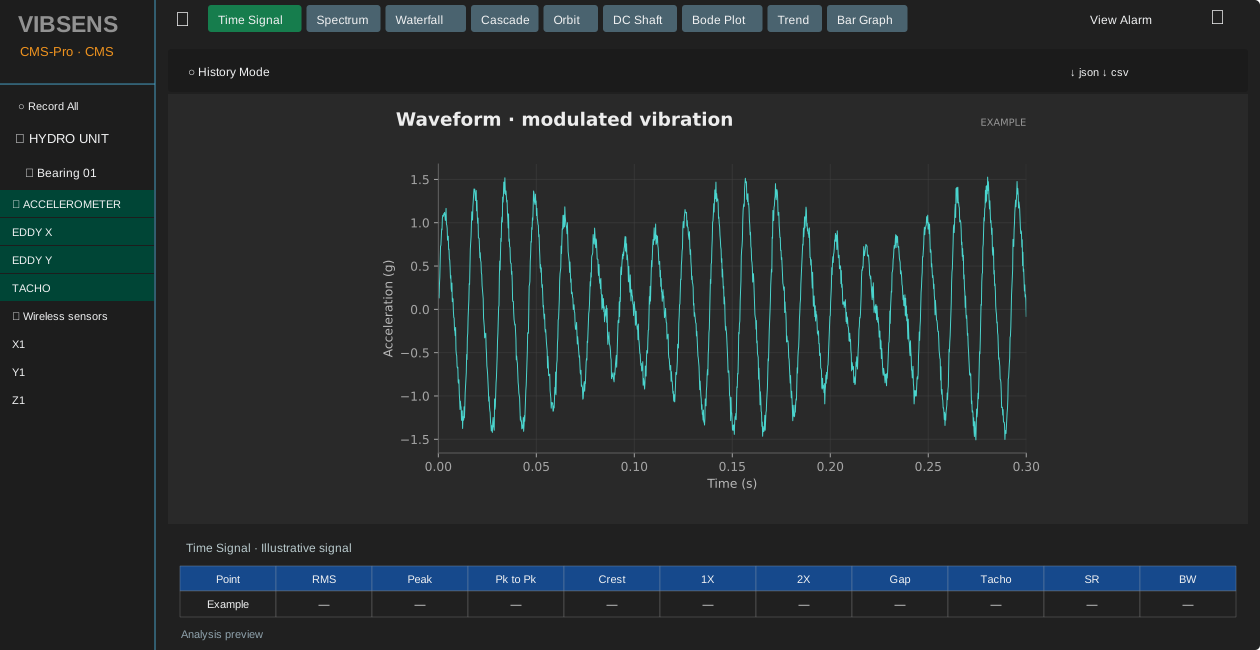
Time waveform analysis
See how vibration changes within each revolution. The time waveform preserves the shape and timing of the measured signal, making it useful for investigating impacts, modulation and repeating events that may be less obvious in an overall vibration value.
Compare waveform behaviour with the spectrum and operating speed. Signal amplitude, units and acquisition settings should be reviewed together before drawing a diagnostic conclusion.
FFT vibration spectrum
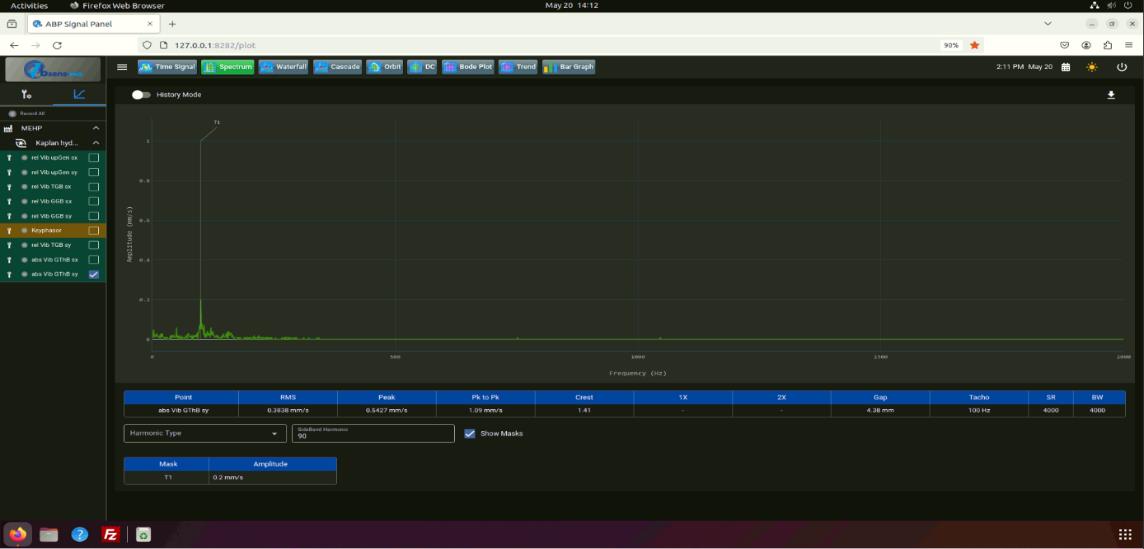
Separate a vibration signal into its frequency components. The spectrum helps engineers examine running-speed harmonics, sub-synchronous components and other peaks associated with machine behaviour.
Use frequency and amplitude together to investigate a change. A peak alone does not establish a fault: compare it with machine speed, measurement direction and the other available channels.
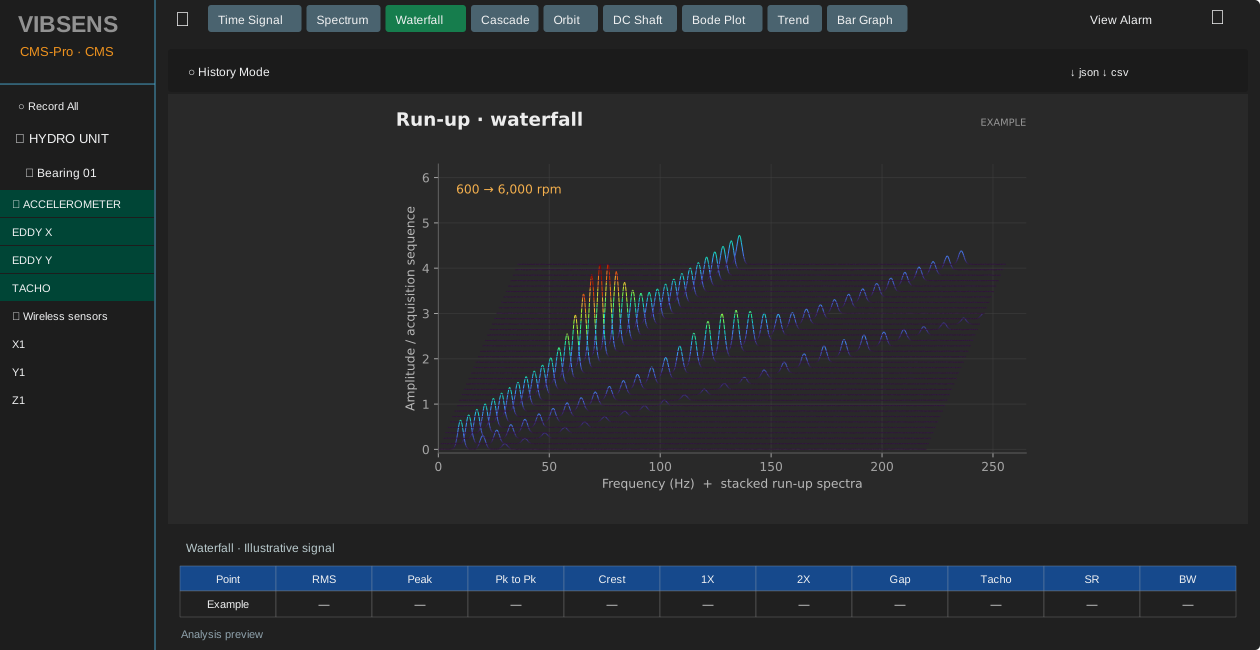
Waterfall spectrum analysis
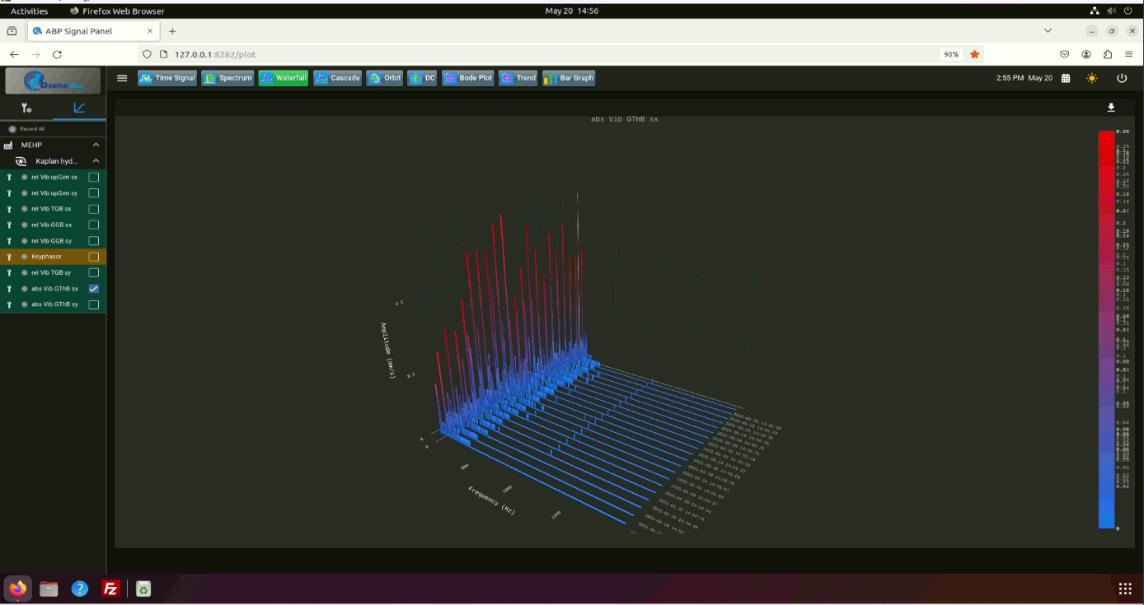
View a sequence of spectra in a three-dimensional arrangement to follow changing frequency content. Waterfall analysis helps show how vibration develops over time or through a change in operating conditions.
Look for persistent components and emerging peaks across the sequence. The view adds context to an individual FFT spectrum and supports the review of changing machine behaviour.
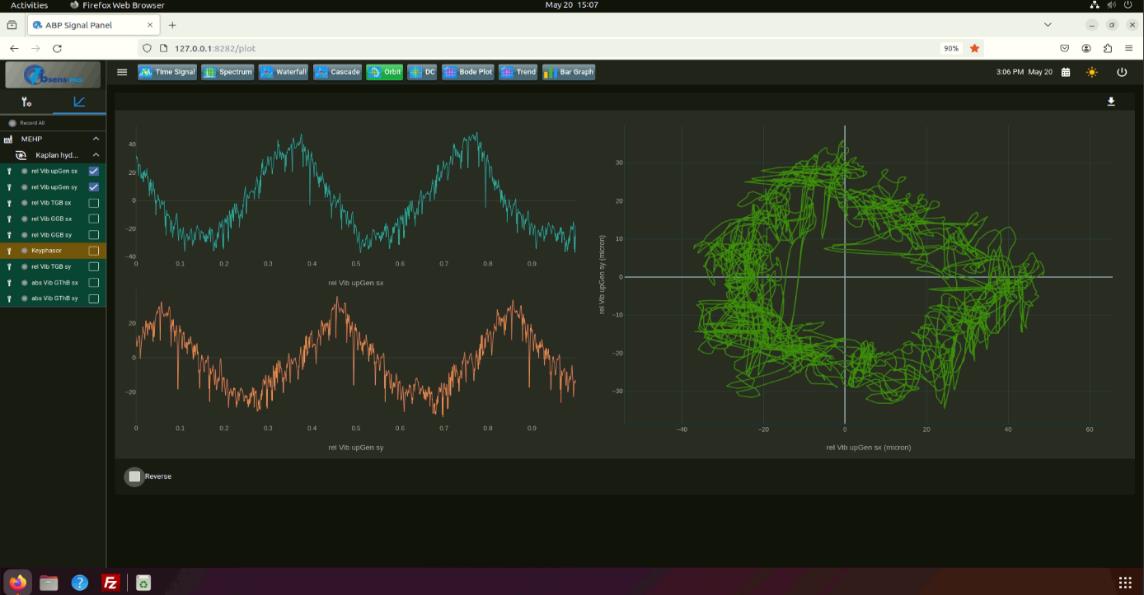
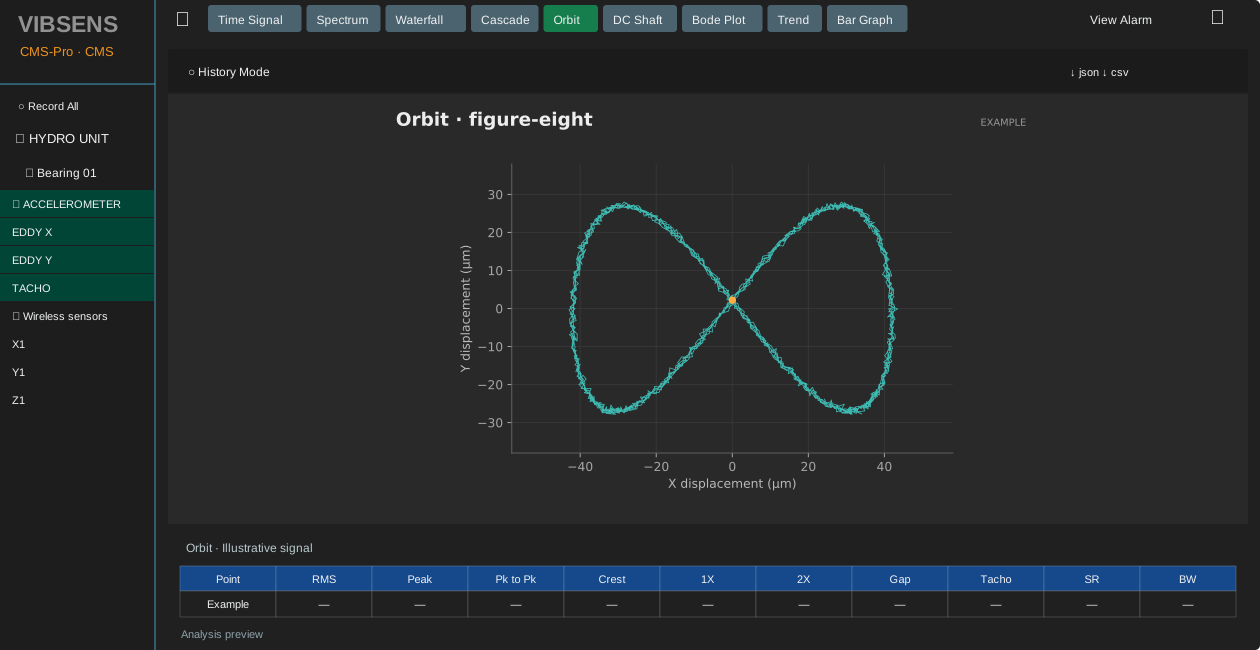
Shaft orbit analysis
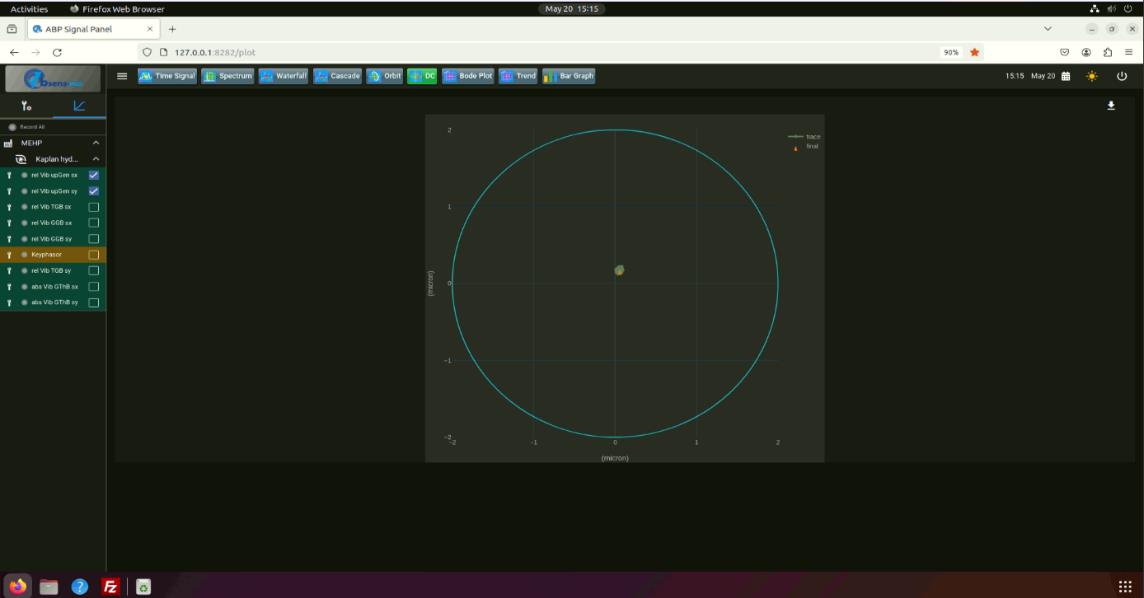
An orbit combines two radial displacement measurements to show the path of the shaft within a bearing. Its shape and orientation help engineers investigate rotor motion and compare operating conditions.
Interpret the display with probe orientation, scaling and speed in mind. An orbit is a diagnostic view rather than an automatic fault verdict; reliable analysis depends on correctly configured measurement channels.
Shaft centreline monitoring
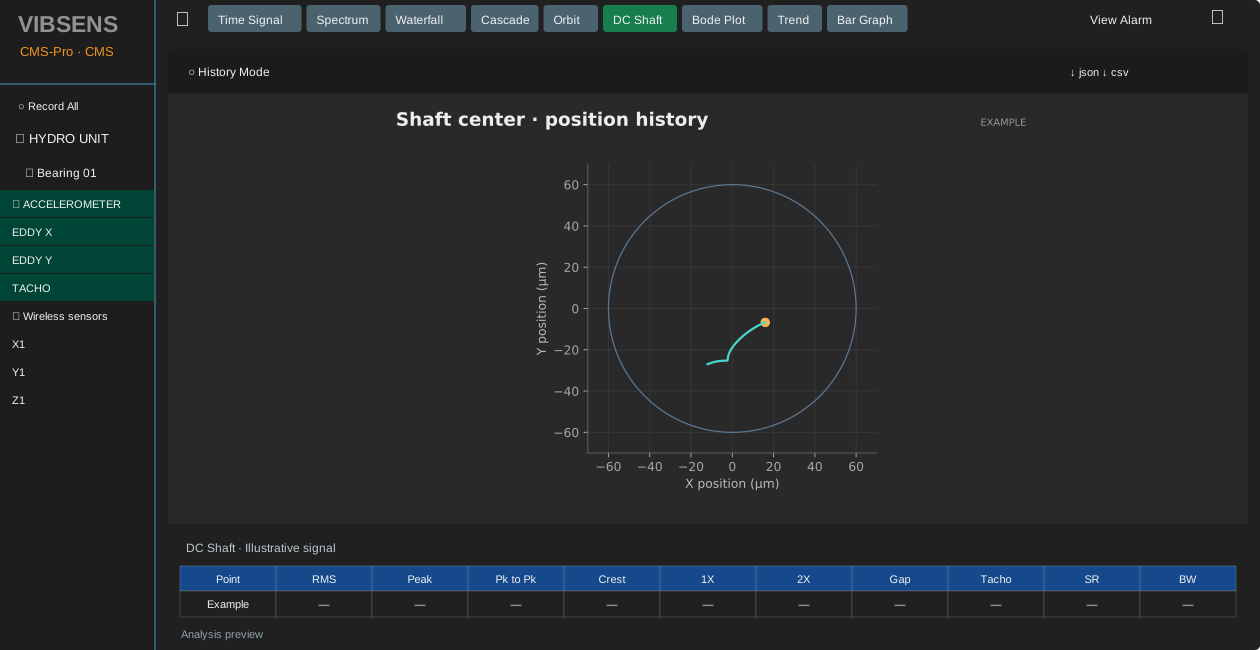
Track the average radial position of a shaft to understand how its position changes with operating conditions. The centreline view complements the dynamic orbit by focusing on the position around which the shaft moves.
Compare position changes with startup, loading and shutdown. Probe gaps, reference position and bearing geometry provide essential context when assessing a movement.
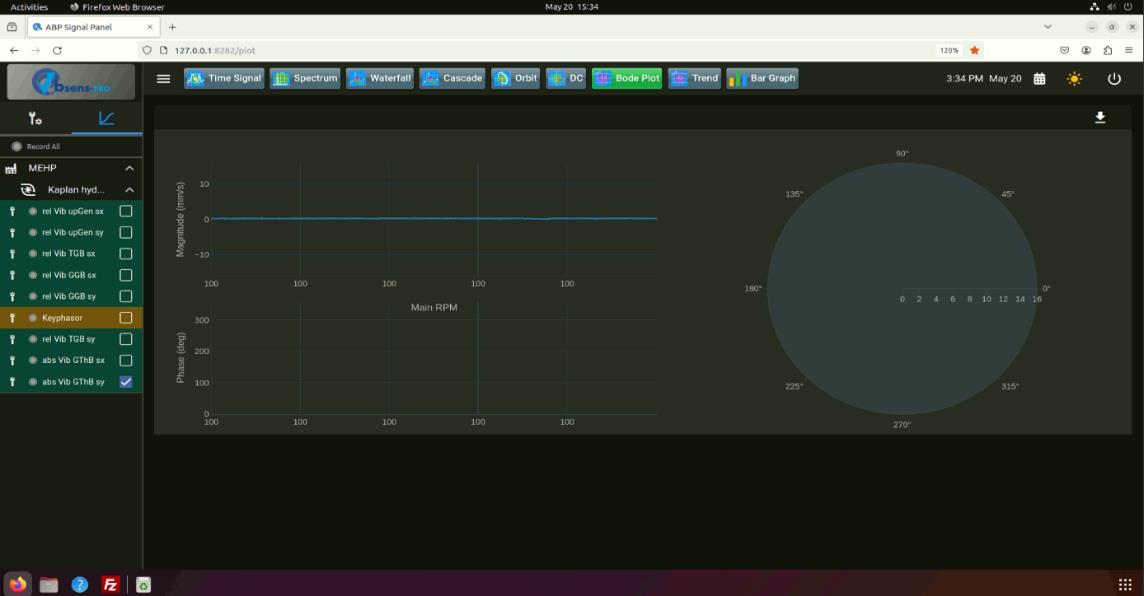
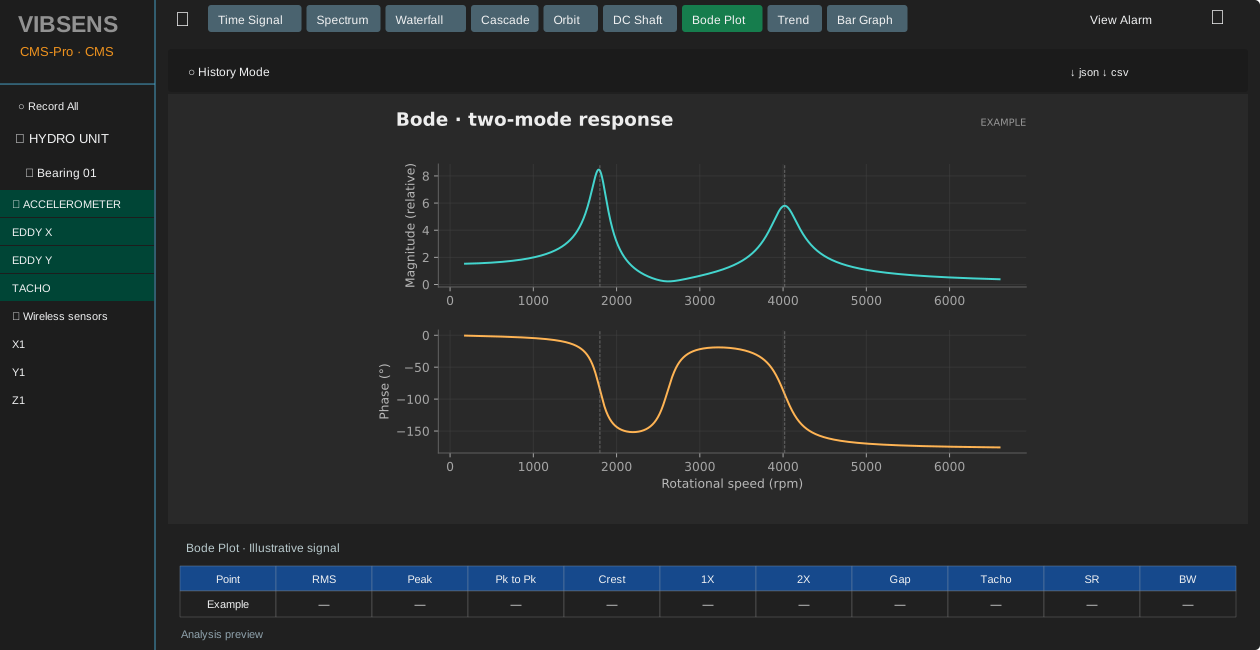
Bode plot: amplitude and phase versus speed
Review vibration amplitude and phase as rotational speed changes. The paired trends help engineers study rotor response during run-up or coast-down and investigate regions of changing dynamic behaviour.
A speed reference and suitable vibration channels are required for meaningful interpretation. Compare amplitude peaks with phase behaviour and repeat measurements under comparable conditions.
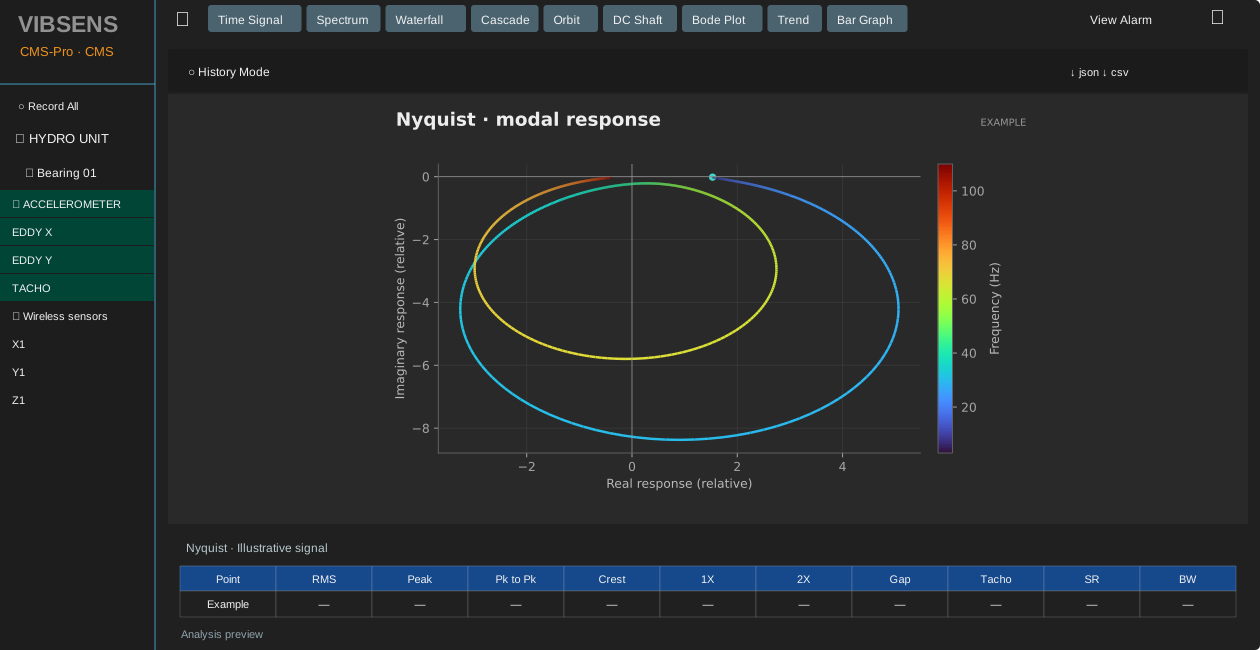
Polar vibration analysis
Display vibration amplitude and phase together in a polar plane. This view helps reveal changes in the vibration vector that can be harder to follow in separate amplitude and phase charts.
Review the trajectory alongside the Bode plot and operating speed. Consistent phase reference and measurement configuration are important when comparing different operating runs.
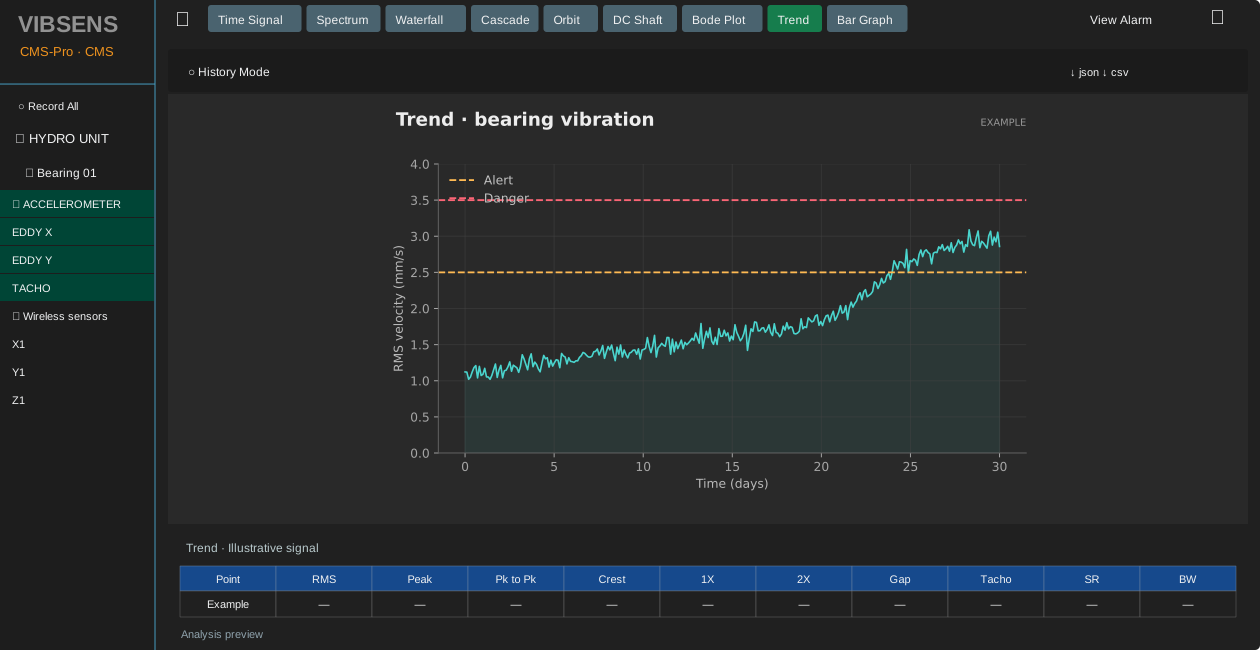
Vibration trend monitoring
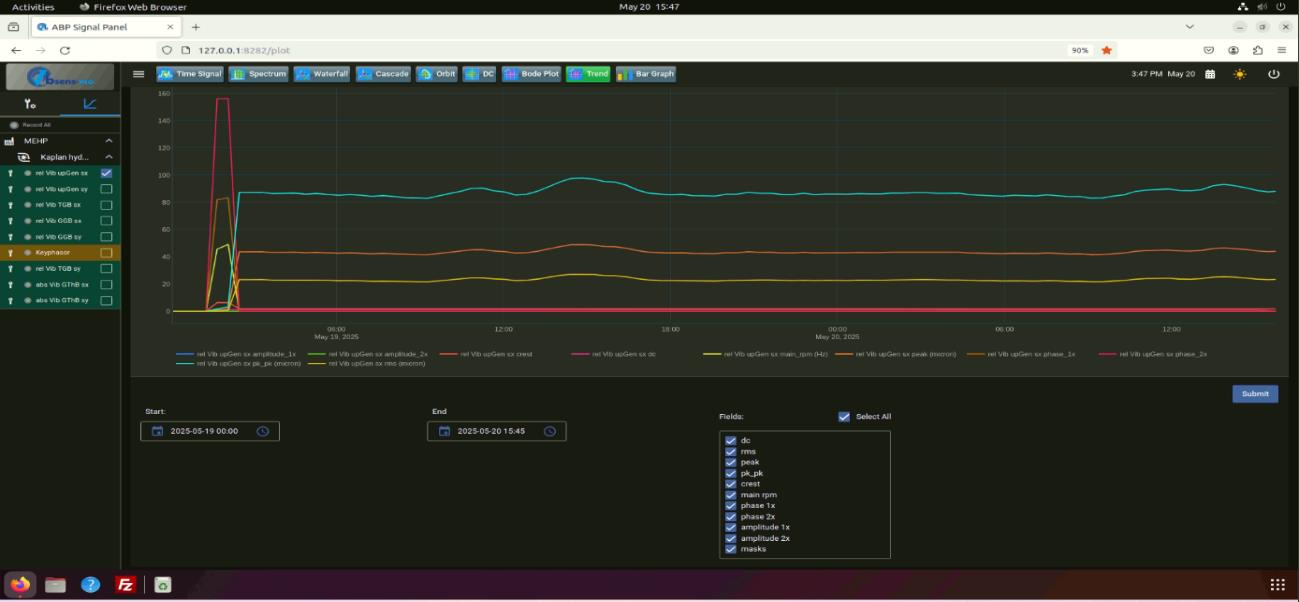
Follow measured parameters over longer periods to put an individual reading in context. Trend analysis helps maintenance teams distinguish stable behaviour from gradual deterioration or a sudden change.
Compare equivalent operating conditions and relevant process information. The value of a trend comes from consistent measurements and an understanding of how load and speed affect the machine.
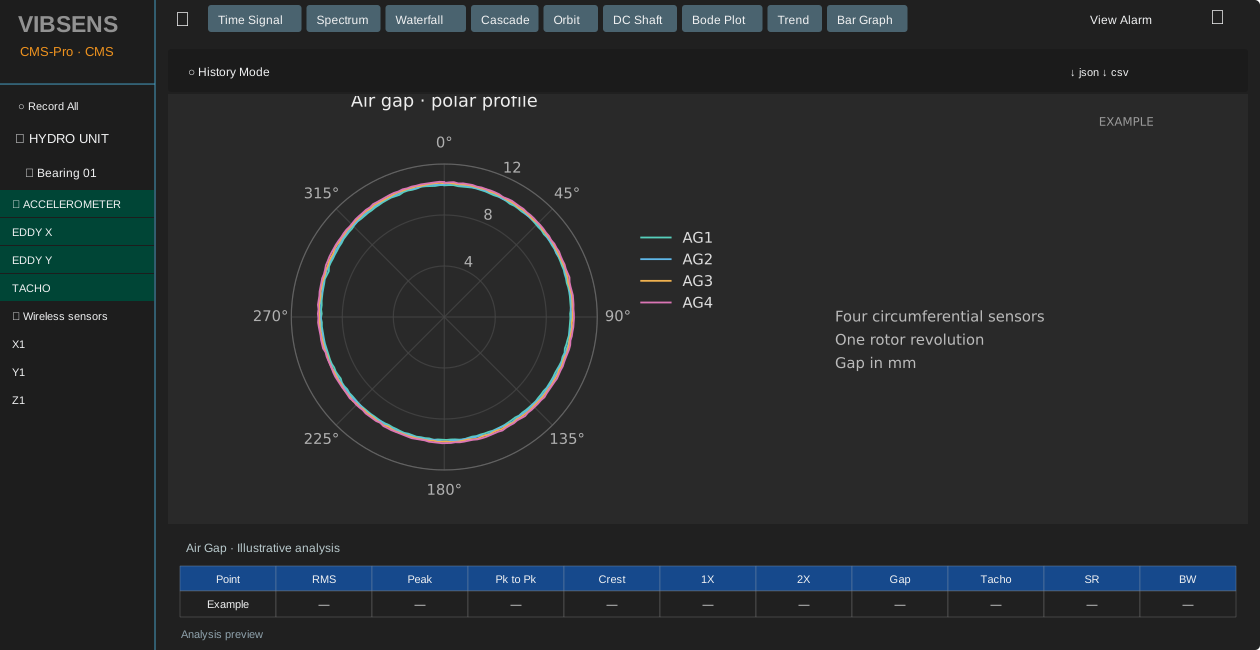
Air-gap polar view
Visualise the distribution of generator air-gap measurements around the machine. A polar presentation helps engineers review circumferential variation as part of a hydro generator monitoring workflow.
Air-gap analysis depends on the installed sensors, channel configuration and machine geometry. Discuss the required measurement arrangement and software configuration with VIBSENS.
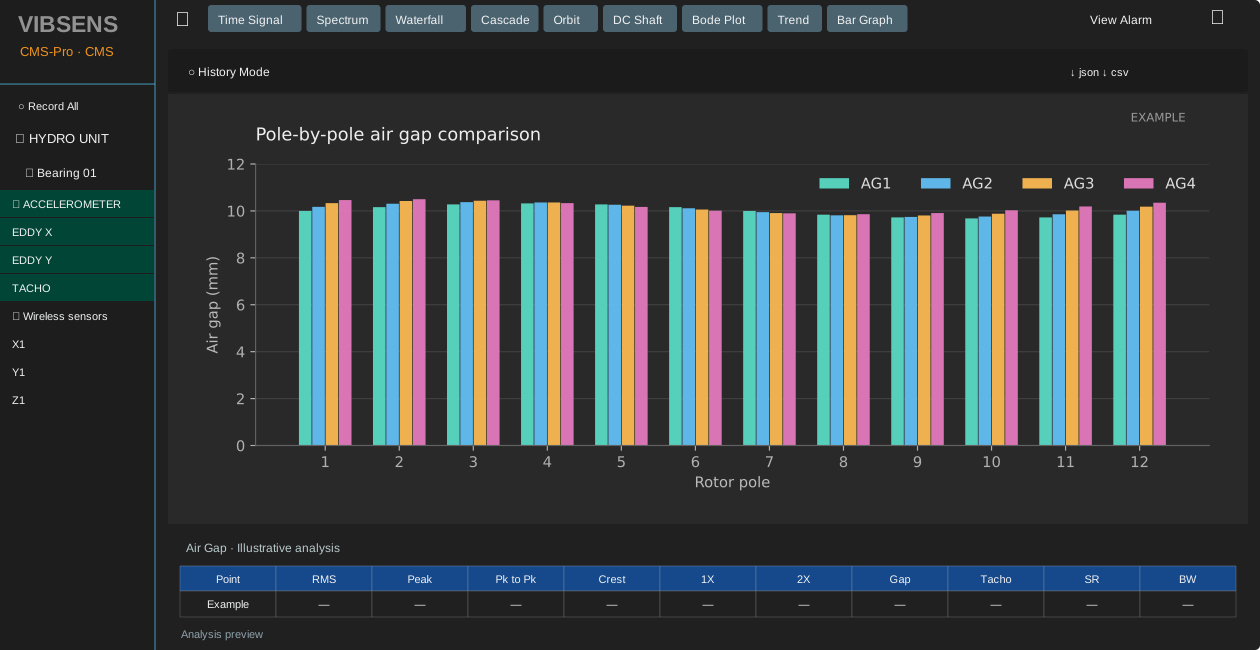
Pole-by-pole air-gap analysis
Compare air-gap behaviour across rotor poles in a dedicated view. This perspective can help engineers locate patterns that would be obscured by a single average measurement.
Interpret pole-related differences together with the sensor arrangement and operating condition. The illustrated view demonstrates the analysis format; it is not a report from a named customer installation.
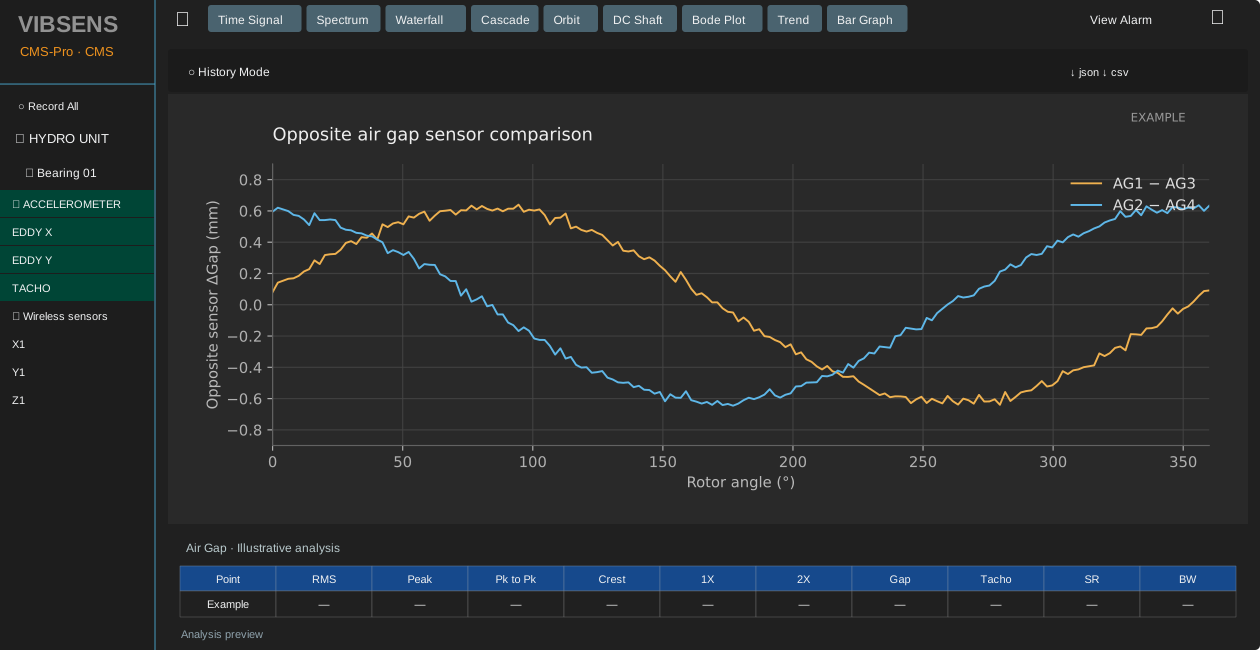
Opposing air-gap measurements
Compare measurements from opposing positions around a generator to explore differences in the rotor-to-stator gap. The paired view provides another way to examine spatial behaviour.
Use this view alongside the polar and pole-by-pole presentations. Confirm the required sensor arrangement and available analysis functions for the proposed CMS-Pro system.
Connect the analysis to your turbine and generator.
Combine a clear understanding of shaft behaviour with a measurement strategy suited to the hydro unit. Explore VIBSENS hydro turbine monitoring and the V6000 machinery protection platform.
Hydro turbine solutions ↗
Plan your CMS-Pro configuration
Share your machine type, sensor arrangement, required analysis views and data acquisition system. Our team can help define an appropriate software and measurement configuration.
Discuss your application ↗More ways to compare machine behaviour
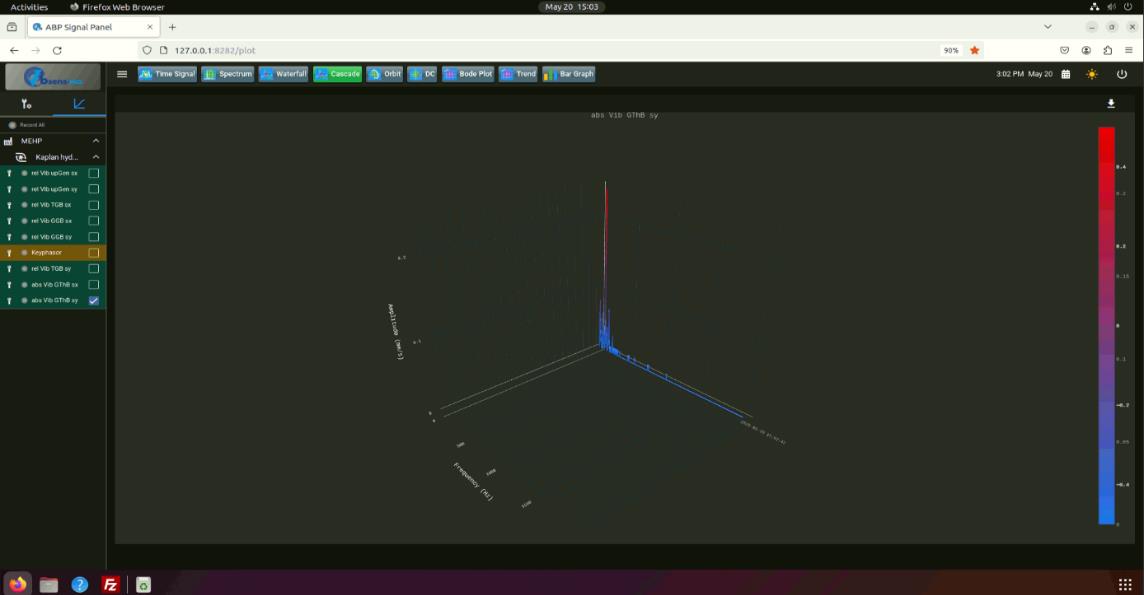
Cascade analysis
A cascade view stacks spectra so that successive measurements can be compared. It helps engineers follow changes in frequency components and relate those changes to the measurement sequence or machine operating condition.
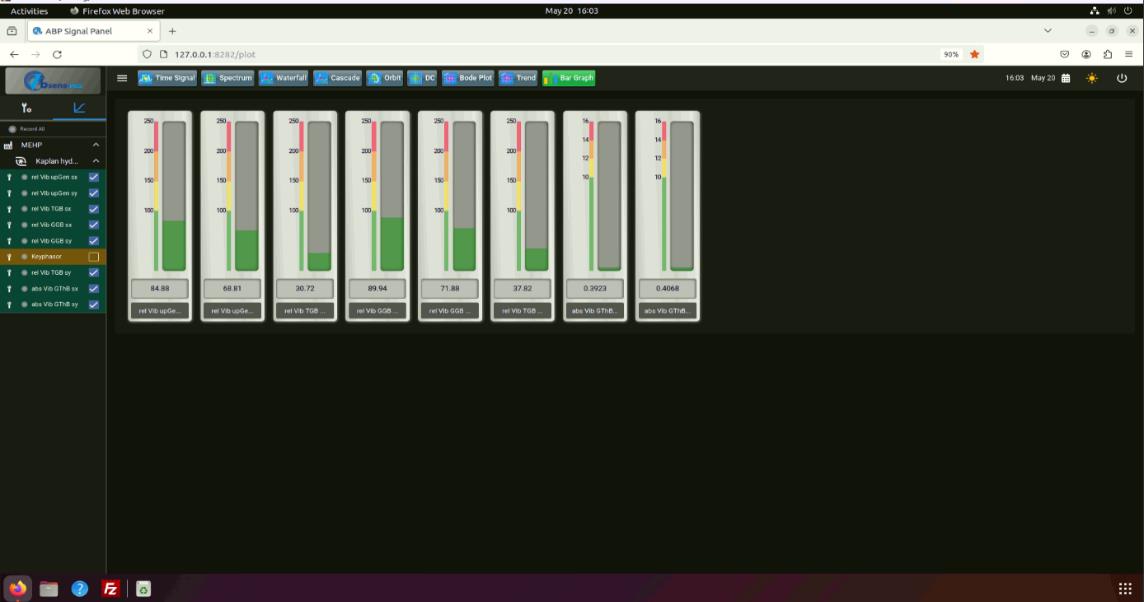
Bar graph overview
A bar graph presents channel values side by side for a compact overview. Compare values with their units, scales and operating context; different measurement types should not be treated as directly interchangeable.
Software screen gallery
Explore the supplied software captures. Open any image to view it at its original size.